AstroMap
Interactive space visualization
Use the Layers panel on the map to toggle these features:
Loading AstroMap...
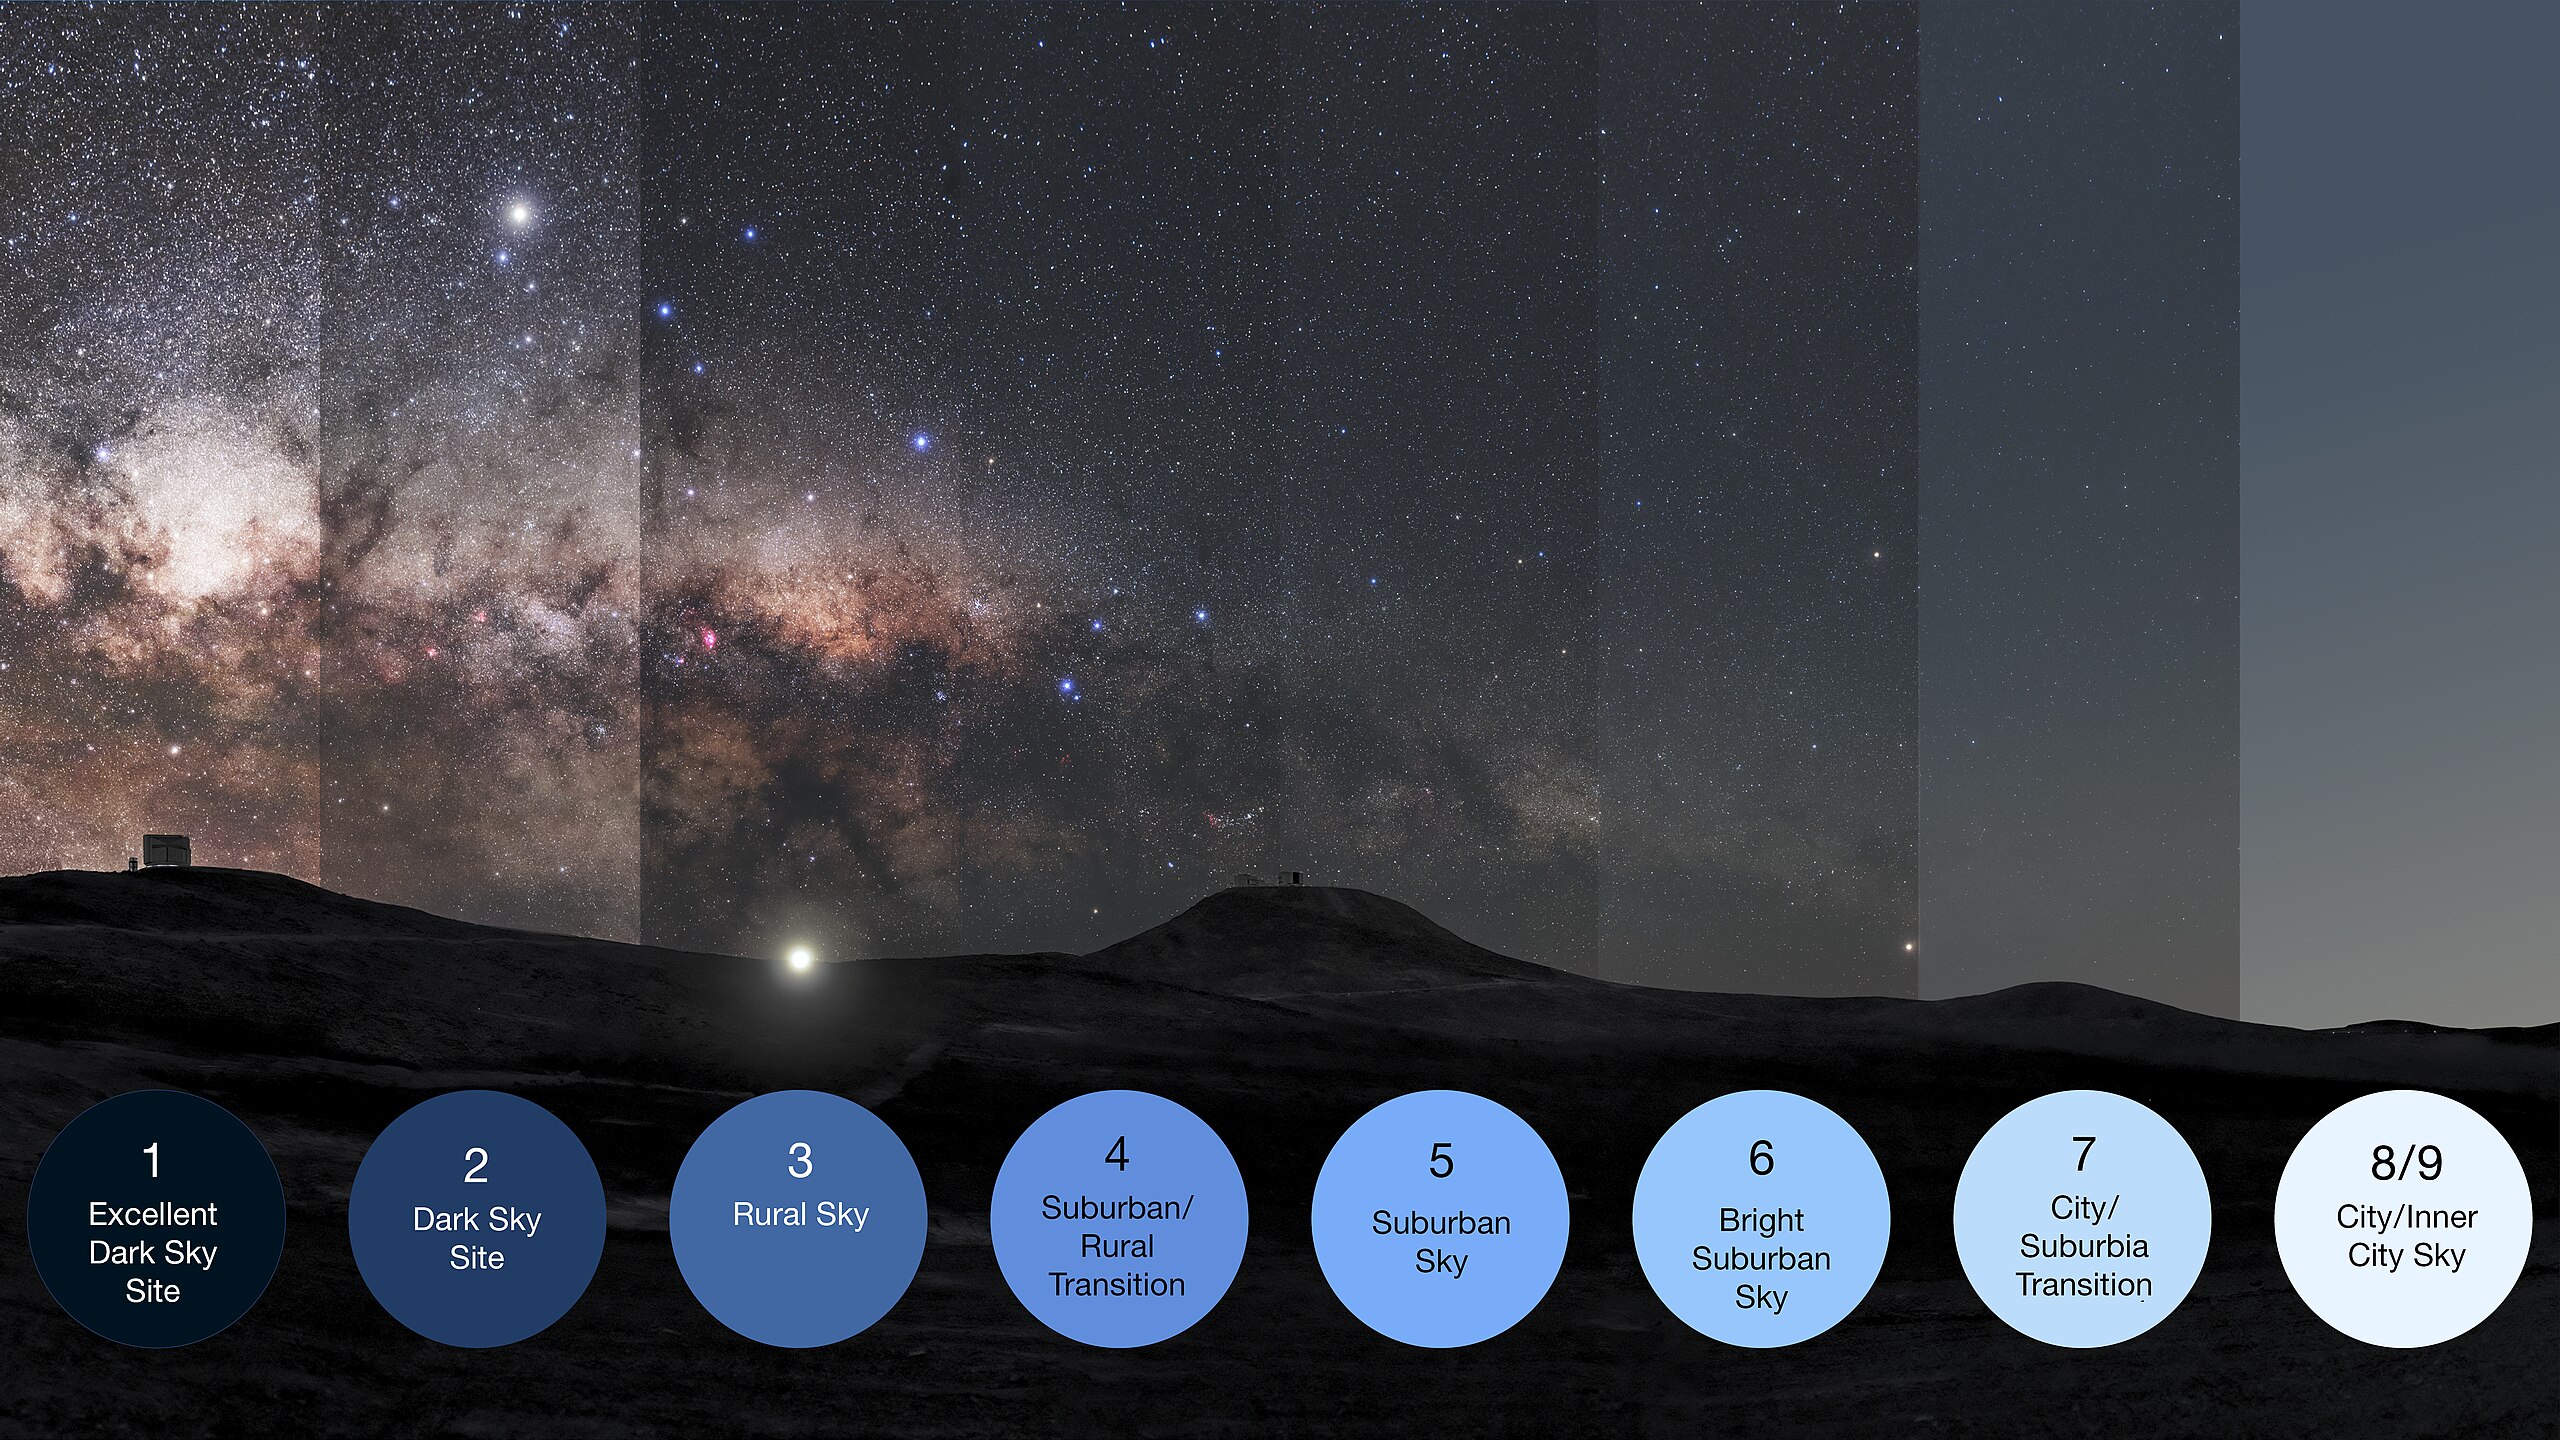
© ESO/P. Horálek, M. Wallner - Representation of the Bortle scale
Bortle Scale
The Bortle Scale is a nine-level numeric scale that measures the night sky brightness at a specific location. It was created by amateur astronomer John E. Bortle and published in 2001 in Sky & Telescope magazine.
What is SQM?
SQM (Sky Quality Meter) is an instrument that measures the night sky brightness in magnitudes per square arcsecond (mag/arcsec²).
Difference between Bortle and SQM:
- Bortle: Subjective scale based on visual observations (1-9). Easier to use without equipment.
- SQM: Objective measurement with electronic instrument. Typical values: 16 (city center) to 22+ (pristine sky).
Approximate conversion:
Data updates:
Light pollution data is based on images from the VIIRS (Visible Infrared Imaging Radiometer Suite) satellite. The map is updated annually by D. Lorenz from NOAA data. Use the year selector in the Layers panel to view historical data (2016, 2020, 2022-2024) or play a timelapse.
Light Pollution
VIIRS satellite imagery (2016-2024). Shows artificial sky brightness using the Bortle scale (1-9).
Aurora Forecast
Real-time aurora probability from NOAA OVATION model. Filter by KP level (0-9) in Layers panel.
Data: NOAA SWPCLive Satellites
Track the ISS and other space stations in real-time. Positions update every 5 seconds.
More satellitesDay/Night
Live terminator showing sunrise/sunset line. Includes civil twilight transition zones.
Updated in real-timeTips
- • Click on the map to see the location coordinates and Bortle class
- • Use the Layers panel (right side) to toggle overlays and adjust opacity
- • Enable Aurora layer to see the KP level filter
- • Enable Light Pollution layer to select historical data year (2016-2024) or play timelapse
- • Click the moon icon to see detailed lunar phase based on your location
- • The ISS trajectory shows 45 minutes past and future
- • Aurora is best visible in low light pollution areas (Bortle 1-3)